The once obscure Baltic Dry Shipping Index, which tracks some 50 bulk shipping routes around the globe came to prominence at the start of the Chinese-led commodity supercycle in the early 2000s.
Of the freight rates tracked by the exchange, those for Capesize ships (so named because the vessels are too large to pass through the Panama Canal), provide the best insight into the health of Chinese commodity demand.
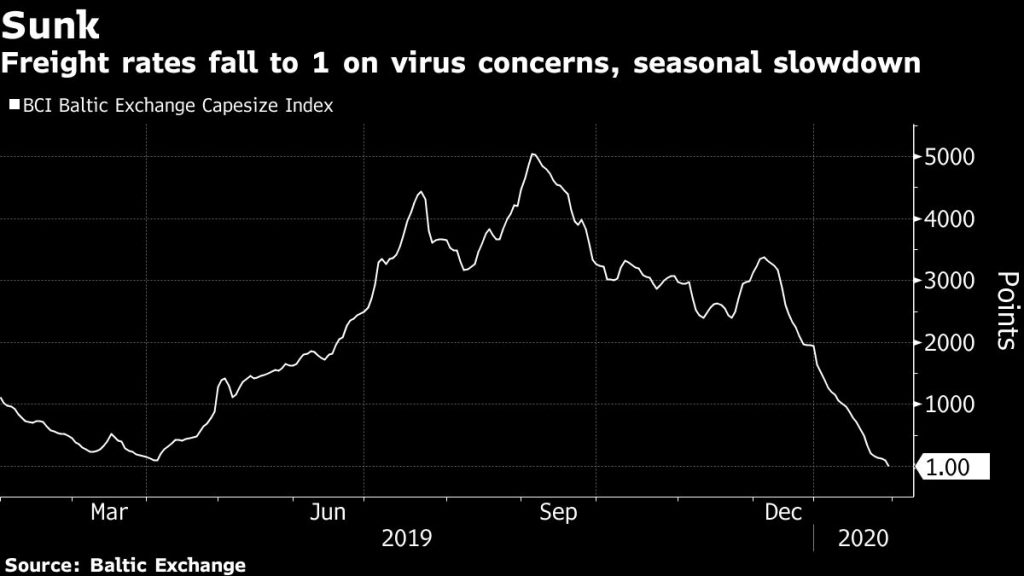
The Capesize index, which measures demand for vessels versus availability of ships, is down to 1 point. One single point. In early September, the index was at 5,043 points although in April it reached a low of 92 points.

Daily Capesize rates topped out at an eye-watering $234,000 in June 2008 when shipbuilders could not catch up fast enough with the surge in trade. The rate has now fallen below $4,000, levels last seen in 2016.
Early 2016 was the nadir of the metals and mining cycle when iron ore could be picked up for under $40 a tonne and copper fetched less than $2 a pound.
The Chinese import price of 62% Fe content ore dropped sharply after the resumption of activity following the Chinese lunar new year break to $84.94 per dry metric tonne, according to Fastmarkets MB. Declines now top 9.4%.
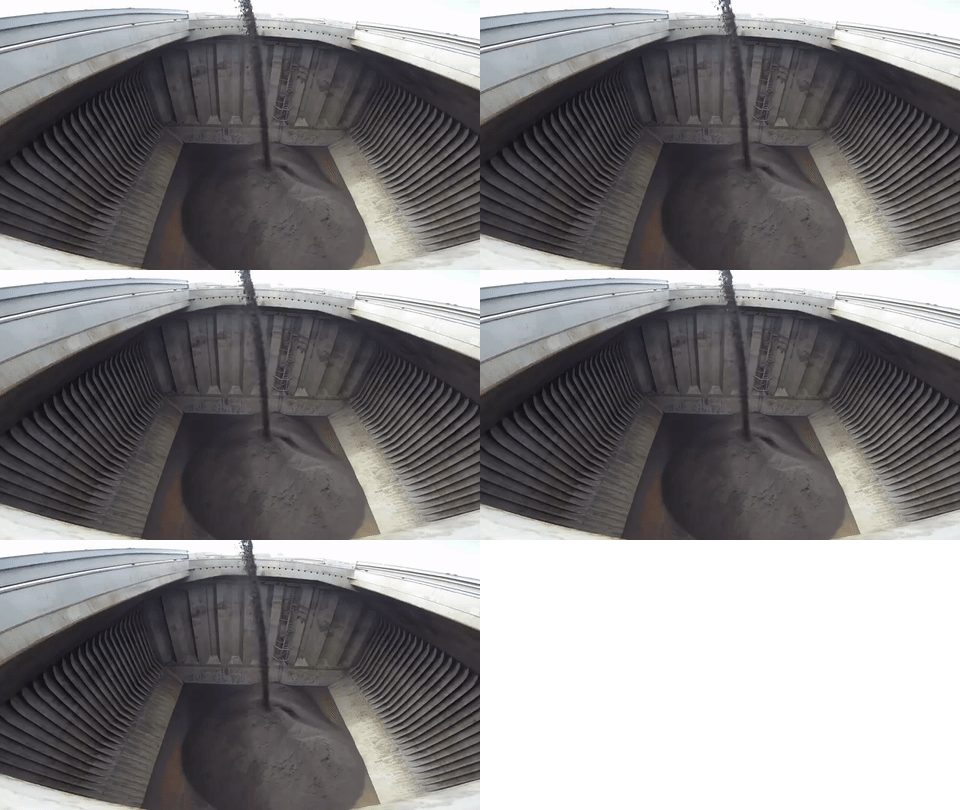
Capesize vessels can haul roughly 160,000–180,000 tonnes and are the dominant vessels for the world’s 1.5 billion tonnes of seaborne iron ore trade.

The steelmaking ingredient represents more than a fifth of the global dry bulk trade and is the second most traded commodity after crude oil and ahead of coal.
The broader Baltic Dry Index which also tracks soft commodities has halved in a month, also falling to 2016 levels.


